Basic plots
basic-plot.RmdImport csv
You should have 4 columns of data that look like this:
| condition | day | dead | censored |
|---|---|---|---|
| WT | 10 | 2 | 0 |
| WT | 12 | 0 | 1 |
| … | … | … | … |
# This is a fictional dataset that is bundled with the package, and is used
# for the purposes of this tutorial
data(sample_data)
dat <- sample_data

head(dat) # see the first few rows
#>   X condition day dead censored sex
#> 1 1        WT   0    0        0   M
#> 2 2        WT   1    2        1   M
#> 3 3        WT   2    1        0   M
#> 4 4        WT   3    1        0   M
#> 5 5        WT   4    3        0   M
#> 6 6        WT   5    1        0   M
To import your own data, do the following:
- Export your Excel table as a
csvfile (eg:your-csv-file.csv). Note that all your conditions must be in the same sheet. - Create an R project in the same folder as your
csvfile. - Use the following line of code to import your
csvfile into R.
dat <- read.csv("your-csv-file.csv")
head(dat) # see the first few rows
What conditions are present?
unique(dat$condition)
#> [1] "WT"    "Drug1" "Drug2"
Survival plot
run_bulksurv() plots a survival curve, and outputs
median survival, log-rank test and pairwise log-rank test
statistics:
p <- run_bulksurv(dat) # Default: survival curve
#> Joining with `by = join_by(x, condition, day, sex, status)`
#> call: formula = Surv(day, status) ~ condition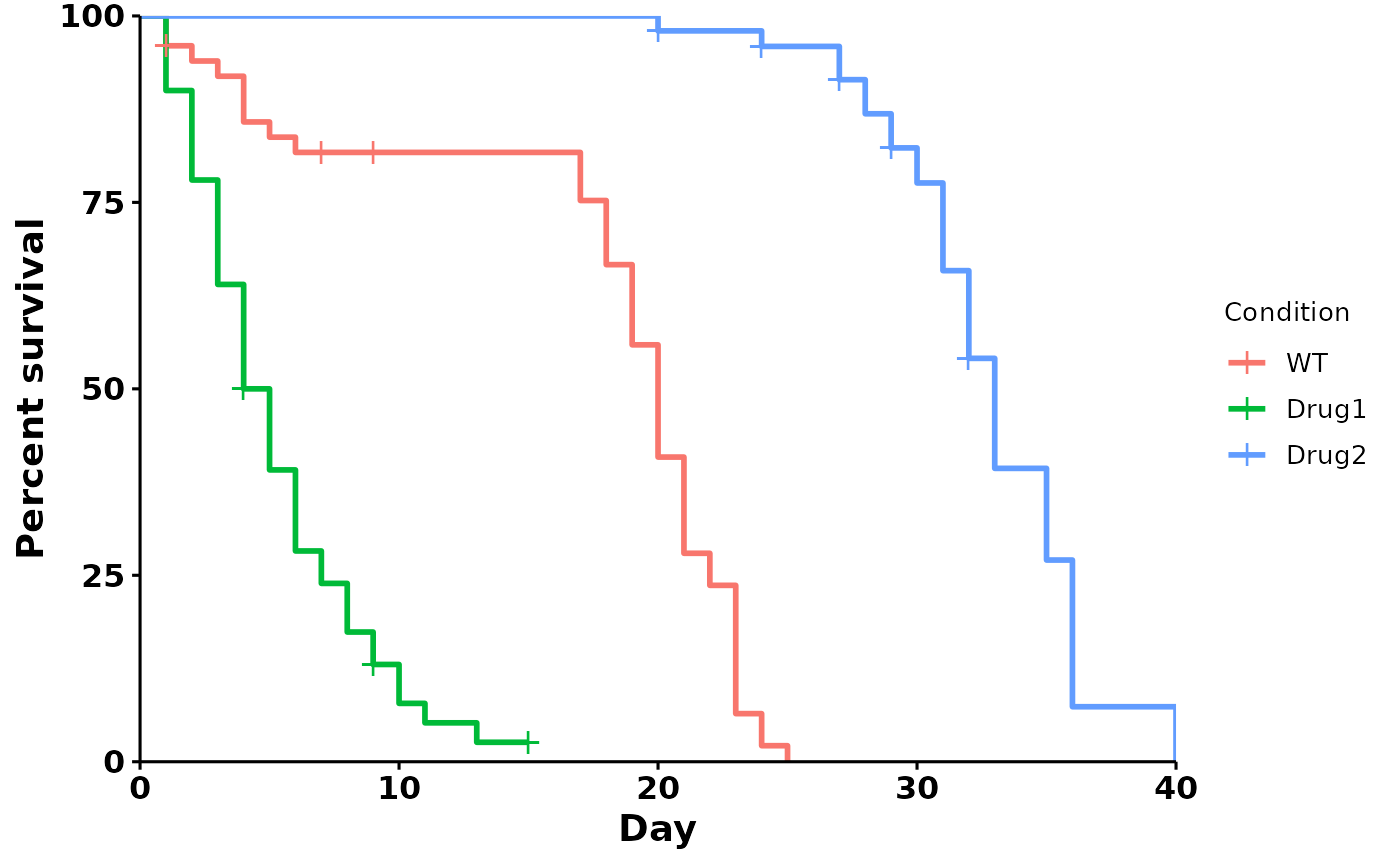
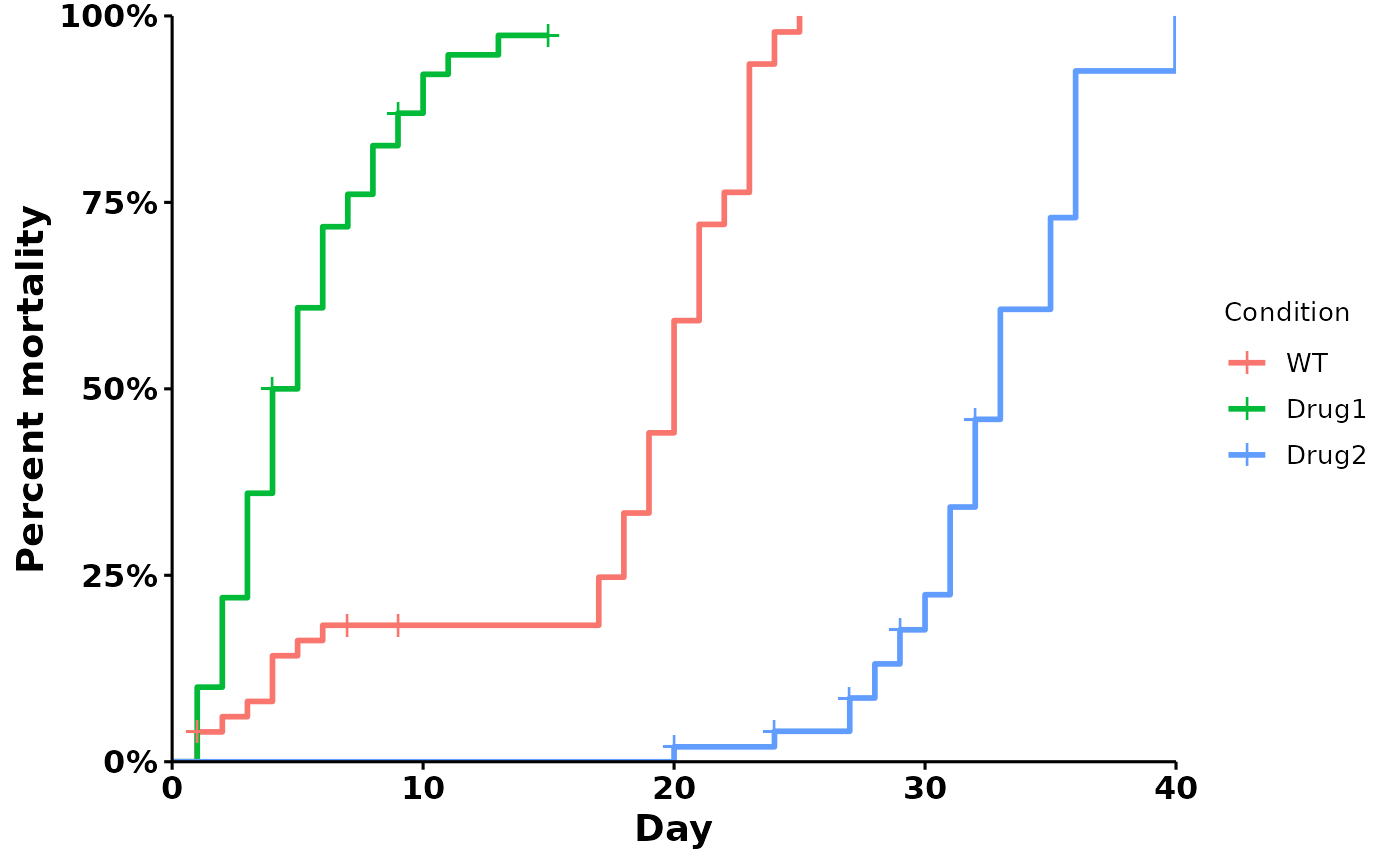
Mortality plot
Use type = "mortality" for a mortality curve:
p <- run_bulksurv(dat,
                  print_stats = FALSE,
                  type = "mortality")
#> Joining with `by = join_by(x, condition, day, sex, status)`
#> call: formula = Surv(day, status) ~ condition