run_bulksurv
run_bulksurv.RdThis function performs a default survival analysis by running these steps:
Calculate individual survival:
get_indiv_surv()Fit survival curve by condition:
fit_surv()Plot survival curve:
plot_surv()
run_bulksurv(
  sample_data,
  sample_order = unique(sample_data$condition),
  type = "survival",
  formula = "Surv(day, status) ~ condition",
  print_stats = FALSE,
  print_plot = TRUE,
  returnData = FALSE,
  add.conf.int = FALSE,
  add.pval = FALSE,
  add.median.survival = FALSE,
  p_adjust_method = "BH",
  ...
)
Arguments
- sample_data
data.frame, bulk survival data- sample_order
character vector of conditions. Eg: c("WT", "Drug1", "Drug2")
- type
character, either "survival" (survival curve) or "mortality" (mortality curve)
- formula
A
characterstring passed to a survival::survfit.formula. Default: "Surv(day, status) ~ condition"- print_stats
logical, whether to print median survival, log-rank test and pairwise log-rank test with p-value corrections. Default: TRUE
- print_plot
logical, whether to print the plot. Also returns plot as a
ggplotobject for further modification. Default: TRUE- returnData
logical, whether to return plot and statistics as a list? Default: FALSE
- add.conf.int
logical, whether to add the 95% confidence intervals. Default: FALSE
- add.pval
logical, whether to add the log-rank test adjusted p-value. Default: FALSE
- add.median.survival
logicla, whether to add the median survival line. Default: FALSE
- p_adjust_method
either "holm", "hochberg", "hommel", "bonferroni", "BH", "BY", "fdr", "none". Default: "BH". For details, see
?stats::p.adjust.- ...
additional plot parameters passed to
survminer::ggsurvplot. Some useful parameters:add.conf.int = TRUE,add.pval = TRUE,add.median.survival = TRUE.
Value
A ggplot2 object for the survival curve
Examples
# Default
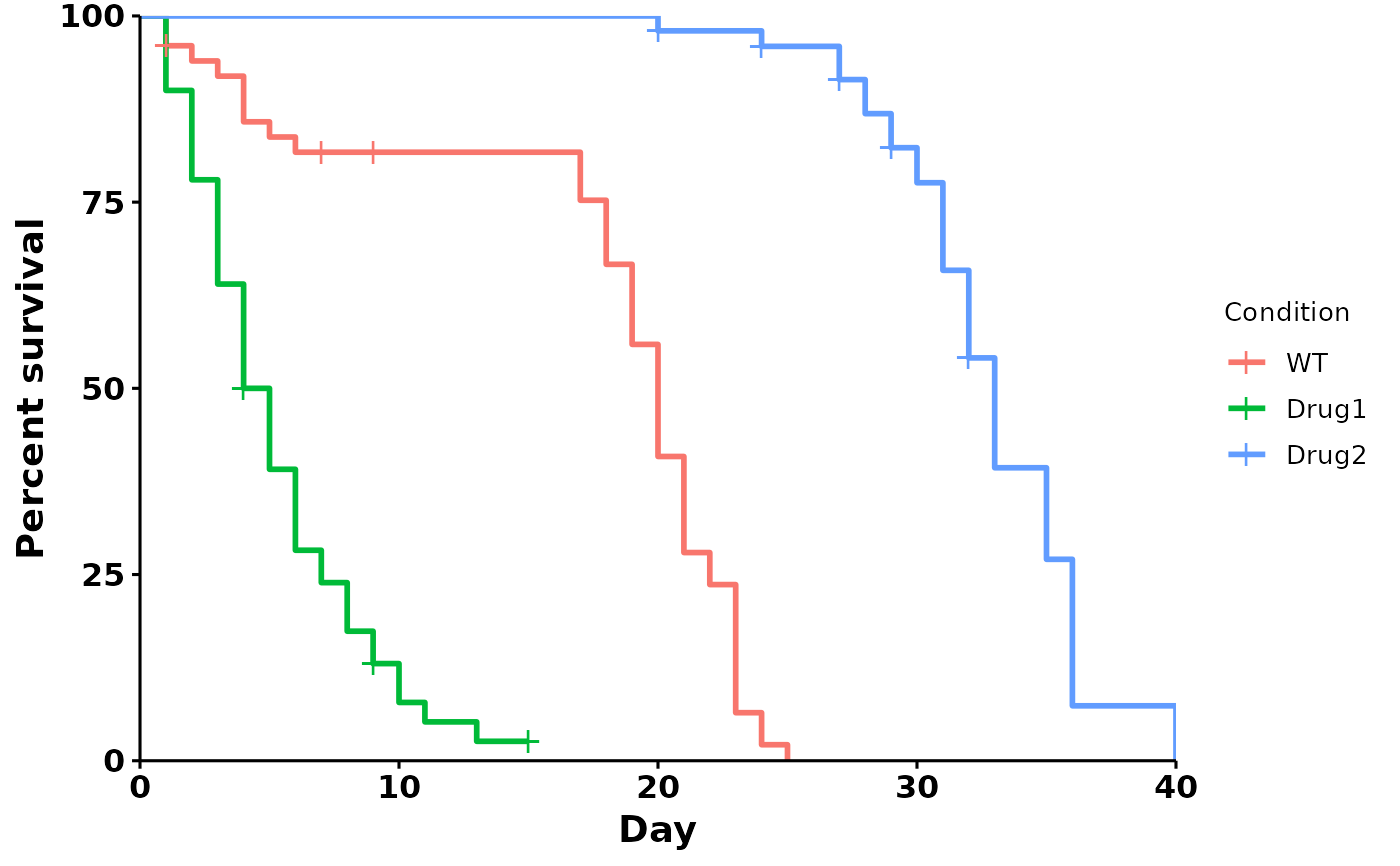
p <- run_bulksurv(sample_data)
#> Joining with `by = join_by(x, condition, day, sex, status)`
#>
#> call: formula = Surv(day, status) ~ condition


# custom formula
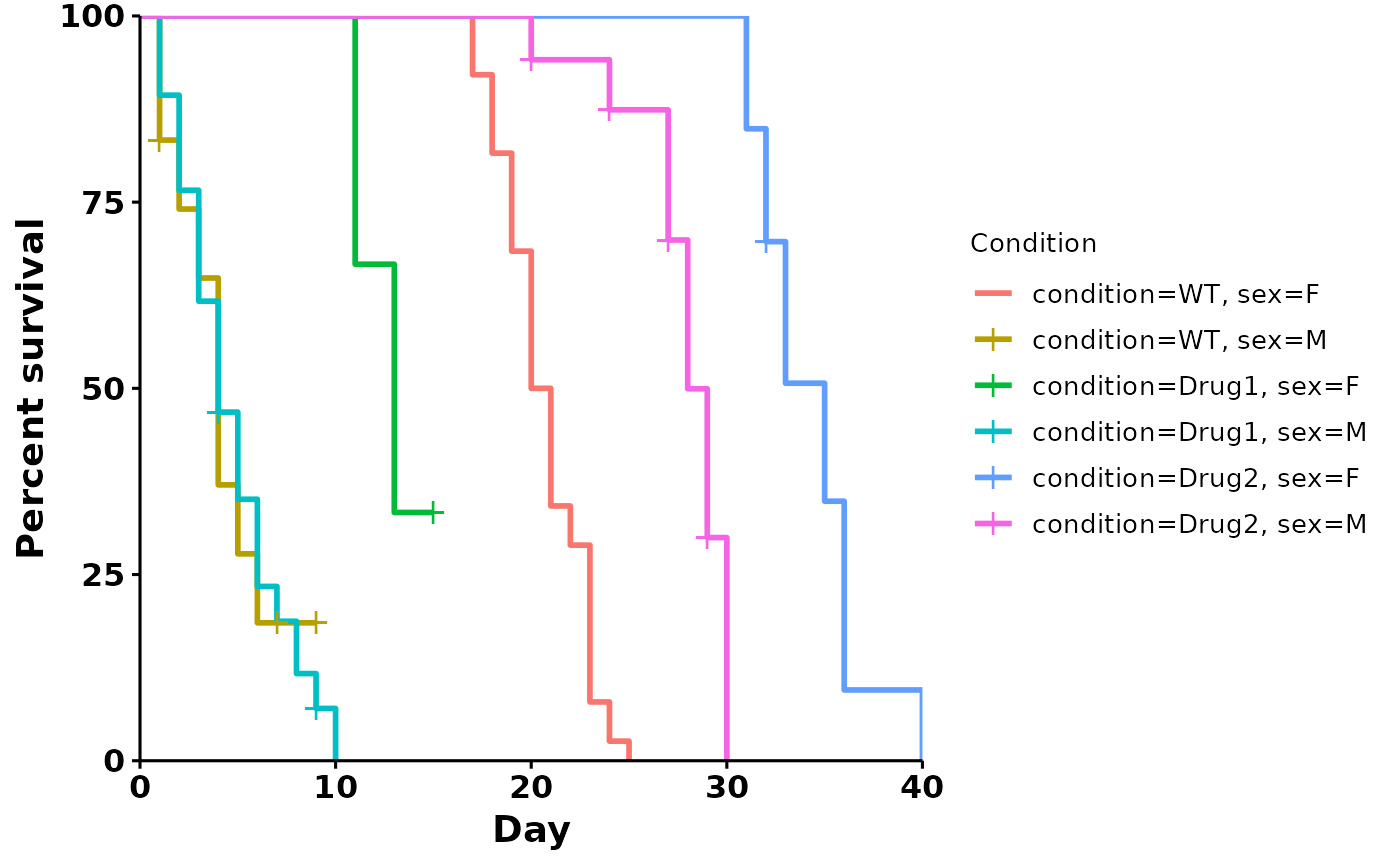
p <- run_bulksurv(sample_data,
                  formula = "Surv(day, status) ~ condition + sex")
#> Joining with `by = join_by(x, condition, day, sex, status)`
#>
#> call: formula = Surv(day, status) ~ condition + sex


# Customized plot
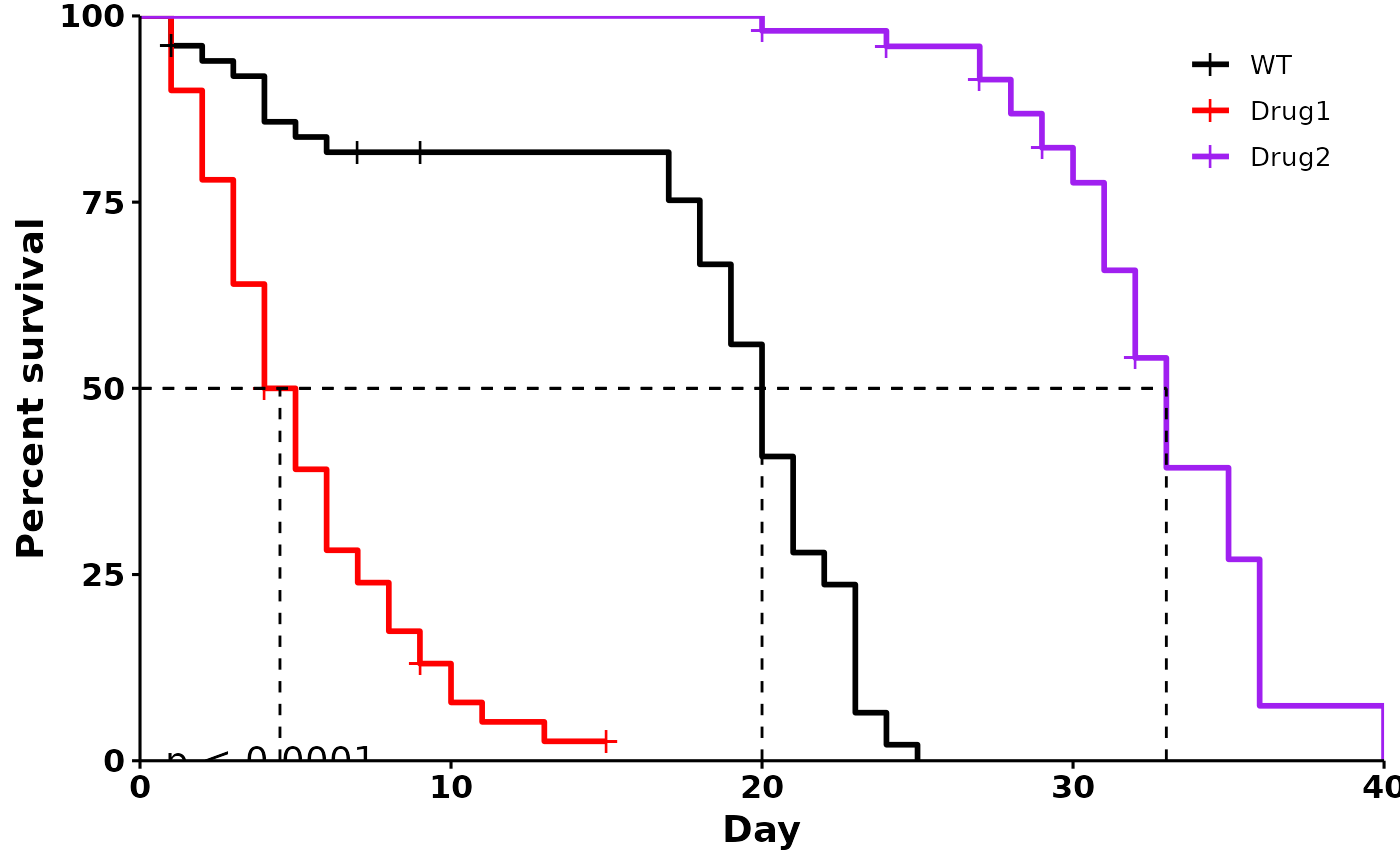
p <- run_bulksurv(sample_data,
                 sample_order = c("WT", "Drug1", "Drug2"),
                 print_stats = FALSE,                   # Don't print stats
                 add.pval = TRUE,                        # Add pvalue
                 add.median.survival = TRUE,                # Add median survival
                 palette = c("black", "red", "purple"), # Custom colors
                 legend.title = "",                     # Remove legend title
                 legend.position = c(0.9, 0.9),         # Position legend at top right
                 break.x.by = 5                         # x-axis breaks at 5-day intervals
                 )
#> Joining with `by = join_by(x, condition, day, sex, status)`
#>
#> call: formula = Surv(day, status) ~ condition
#> Warning: All aesthetics have length 1, but the data has 3 rows.
#> ℹ Please consider using `annotate()` or provide this layer with data containing
#>   a single row.
